Top 5 Best Technical Analysis Tools For Stock Market
4. Parabolic SAR Parabolic SAR is a popular technical analysis tool that helps identify trends and potential price reversals in the market. This tool represent
- by B2B Desk 2024-04-10 08:52:28
In the fast-paced world of simple investment processes, technological advancements and data availability, achieving financial freedom has become easy for everyone. Various tools and methods are available for investing and market research.
Technical analysis tools are crucial for traders to enhance their market strategy and grasp the financial landscape. In this blog post, we have highlighted the top 5 best technical analysis tools for stock market that professional traders and new investors use to obtain important insights on the market and potential price movements. Firstly, let's gain an understanding of what a technical analysis tool is and how it can be beneficial to you.
What is a technical analysis tool?
Technical analysis tools help traders understand market patterns. It helps educate them about the fluctuating prices of stocks, forex, commodities and cryptocurrencies. These tools allow you to predict market changes and maintain self-discipline when making successful decisions.
Technical analysis tools present data in the form of graphs and charts in which patterns can be identified. These models will tell you about market trends, best funds to invest in, trading opportunities and much more. However, the conclusions obtained using technical analysis tools are not reliable; more often than not, they help investors make informed decisions in a highly predictable market.
Benefits of Technical Analysis Tools and Techniques for Traders & Investors
Below is a list of the top 5 best technical analysis tools for stock market- Interpretation of market trends: Technical analysis tools can indicate whether the market is moving up or down.
- Identify potential trading opportunities: Using this tool, you can gain valuable information and identify potentially profitable investment options.
- Manage your risks effectively: With this tool, you can understand and reduce the potential risks associated with market fluctuations.
Top 5 Best Technical Analysis Tools for stock market
Below is a list of the best technical analysis tools for stock trading. However, you should choose the best one or two tools for thorough examination and research of securities.
1. Moving average
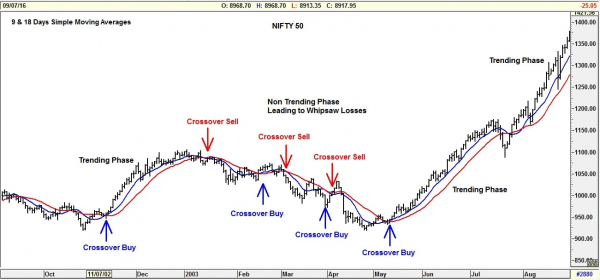
The use of moving averages has long been a common practice in trading. It is a tool that assesses the trajectory of a stock by analyzing past prices and provides buy and sell signals. Calculating a moving average involves adding up all the data points within a specified time period and then dividing the sum by the number of periods. The tool helps traders understand market size by removing noise from market volatility and smoothing the data.
There are two main types of moving averages:
- Simple Moving Averages (SMA): The SMA calculates the average price over a given period, taking into account each data point.
- Exponential Moving Averages (EMA): EMA evaluates the latest prices, making it more responsive to the latest price changes.
2. ADX (Average Directional Index):
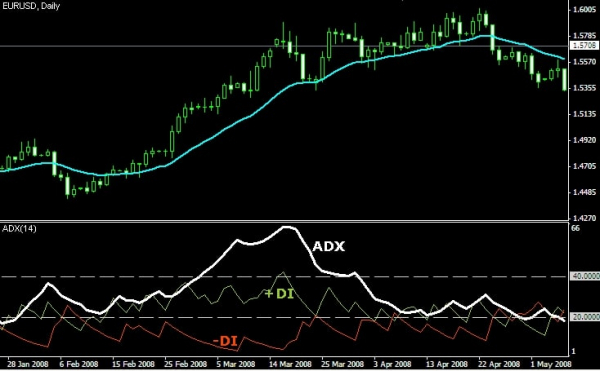
ADX (Average Directional Index) is a highly sophisticated technical analysis tool used by traders. The moving average identifies the trend of the market, while the ADX measures the strength of the trend, showing the intensity of upward and downward movements. A single line on the ADX chart ranges from 0 to 100. Nevertheless, it can be defined by two measures: the positive trend indicator and the negative trend indicator. The values are defined as follows:
0-25: Shows a weak trend or a stagnant market characterized by price fluctuations without a clear trend.
25-50: Indicates a moderate trend with some upside.
50-75: Indicates a strong trend where prices are constantly moving in one direction.
Above 75: indicates a very strong trend but also indicates a potential trend reversal is approaching.
3. Bollinger Bands
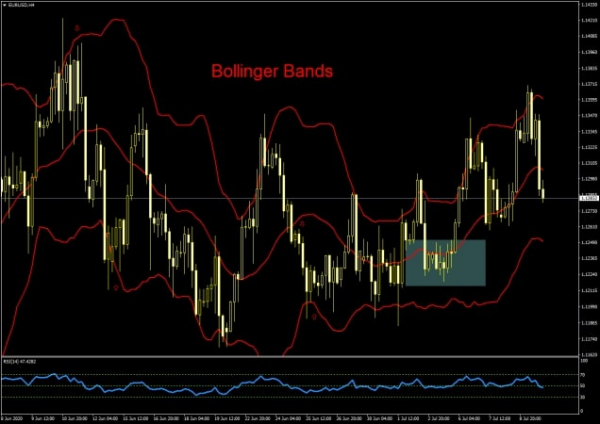
Bollinger Bands are a useful tool in technical analysis that assists traders in analyzing price changes and recognizing possible trading signals. It displays the information using a chart. The tool utilizes two parameters, namely period and standard deviation (StdDev). StdDev calculates volatility, which fluctuates with its increase or decrease.
To take advantage of the usefulness of this tool, you need to place two important points on the chart – the swing high or low – and draw a horizontal line representing the percentage of the previous price movement.
4. Parabolic SAR
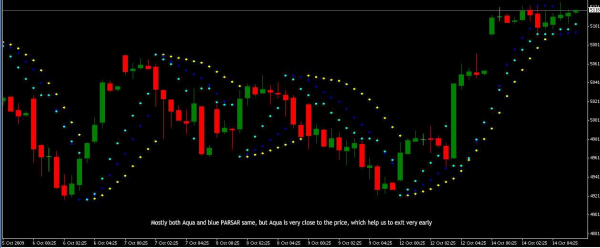
Parabolic SAR is a popular technical analysis tool that helps identify trends and potential price reversals in the market. This tool represents data with points on a price chart. If the dot appears above the price, this indicates a downtrend; If it is below the price, it indicates an uptrend. The Parabolic SAR indicator responds to previous price movements. Hence, it is necessary to use this tool along with a host of other tools.
5. CCI (Commodity Channel Index)
The Commodity Channel Index is a momentum-based tool for traders to measure the current price level to the average price level over a specific period. This tool helps provide insight into overbought and oversold conditions in an asset.
Also Read: Want to make money from the stock market? Remember these 3 key rules

POPULAR POSTS
Calcutta Stock Exchange Really Make a Comeback Heres Whats Going On
by Aayush Ladha, 2026-06-30 12:05:32
Best Silver Investment Platforms for 2025: From CFDs to Digital Vaults Explained
by Shan, 2025-10-23 12:22:46
Best Investment Plans in India for 2025: A Complete Guide to Grow and Protect Your Wealth
by Shan, 2025-09-18 10:20:46
Which venture capital firms are the most active in funding Indian startups in 2025
by Shan, 2025-08-06 10:42:11
Top 5 Apps to Buy Digital Gold in India (2025): Safe, Simple & Secure
by Shan, 2025-08-01 10:24:51
10 Highest Dividend Yield Stocks in August 2025
by Shan, 2025-07-28 09:31:02
Exchange-Traded Fund (ETF): A Practical Guide to Smart Investing
by Anmol Chitransh, 2025-04-17 10:18:20

Follow on Insta
RECENTLY PUBLISHED

How Praveen Gowdru Went From Building VMEDO To Launching Tez Health And Why He Betting On Home Healthcare
- by Aakash Ladha , 2026-07-01 11:01:27

What Is LLM Visibility? A Simple Guide to Checking Your AI Visibility
- by Aakash Ladha , 2026-07-15 11:44:33

How a Kerala Startup is Using Robots to Clean Sewers and Manholes
- by Aakash Ladha , 2026-07-14 12:14:26

Luxemettle Redefining Indias Jewellery Market With Personalized Craftsmanship and Story Driven Design
- by Aakash Ladha , 2026-07-14 12:07:23

OpenAI Launches GPT-Live: Making Conversations with ChatGPT Feel Truly Human
- by Aayush Ladha, 2026-07-14 12:28:52
x
![logo]()