Discover the Best Indicators for Option Trading to Optimize Your Strategy
- by B2B Desk 2024-07-29 10:15:36
Options provide investors with diverse opportunities to enhance their portfolios and generate returns. To fully leverage the potential of options trading, it's essential to use specialized tools for analyzing trades. Among these tools, certain indicators stand out as particularly valuable.
In this article, we'll explore the Best indicators for options trading, shedding light on how they work and why they are crucial in the current market environment.
Understanding Trading Indicators for Options
Before diving into the best indicators for options trading, let’s first clarify what options trading entails. Options trading involves buying or selling the right to trade a specific security at a set price on or before a certain date, depending on whether you hold a call or put option.
Types of Options:
- Call Option: This gives you the right to purchase an underlying asset at a predetermined price within a specified timeframe.
- Put Option: This grants you the right to sell an underlying asset at a predetermined price within a specific timeframe.
Options come in two main varieties:
- American-style Options: These can be exercised at any time up until the expiration date.
- European-style Options: These can only be exercised on the expiration date itself.
Options trading is inherently risky and can result in significant financial loss, especially for beginners who may lack experience or use improper tools. Trading indicators are crucial tools in options trading. They are software programs designed based on established theories, formulas, and ratios to assist traders in making informed decisions.
By understanding and effectively using trading indicators, you can better navigate the complexities of options trading and enhance your chances of success.
Volume Profile
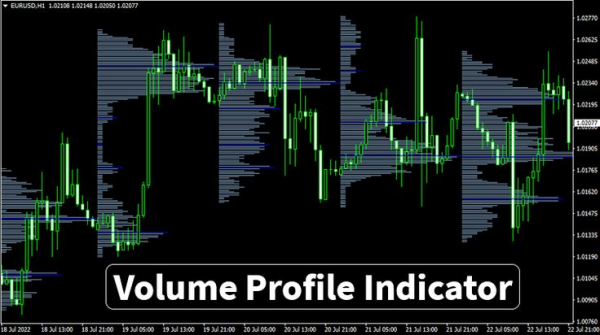
Volume profile is a powerful analytical tool used by traders and investors to gauge market activity and pinpoint key price levels. As the best indicator for options trading, Unlike traditional technical indicators, which focus primarily on price or volume alone, volume profile integrates both elements. It offers valuable insights by displaying the distribution of trading volume across different price levels over a specific timeframe. This helps traders identify areas of high and low trading interest, revealing where significant market activity has occurred.
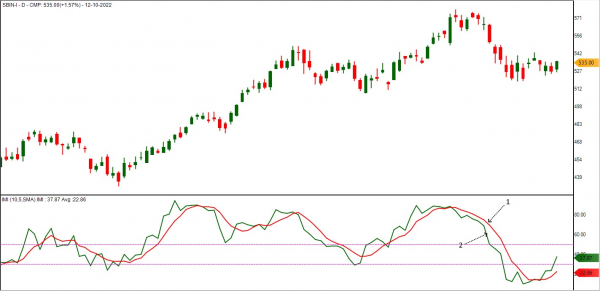
Bollinger Bands
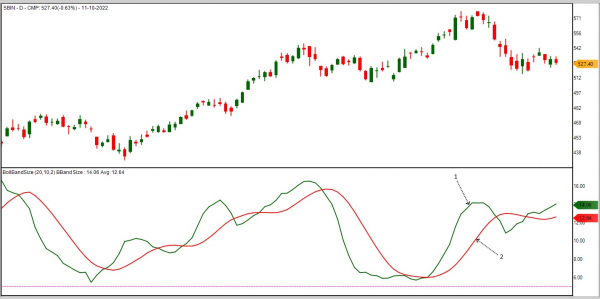
Bollinger Bands are a well-regarded indicator among options traders, providing essential insights into market volatility, which plays a significant role in determining options prices. As the best indicator for option trading, Bollinger Bands adjust their width based on volatility: they expand when market activity is high, signaling potential price swings, and contract during periods of low volatility and stable prices.
The Bands consist of three lines: the middle line is the simple moving average (SMA) of the price, while the upper and lower bands are calculated by adding and subtracting a multiple of the standard deviation from the SMA. The upper band typically acts as a resistance level, and the lower band serves as a support level. When the stock price nears these bands, it often signals potential price reversals. A breakout, where the price moves beyond the bands, indicates a significant shift, but the Bands help in adjusting expectations as the price realigns.
For day trading, Bollinger Bands are particularly useful for spotting trading opportunities. If the price breaks through the upper band, traders might consider buying a Put option or shorting a Call option. Conversely, if the price drops below the lower band, buying a Call option or shorting a Put option might be prudent.
By leveraging Bollinger Bands, options traders can effectively measure market volatility, pinpoint critical support and resistance levels, and make informed decisions to take advantage of potential price movements.
Put-Call Ratio (PCR) Indicator
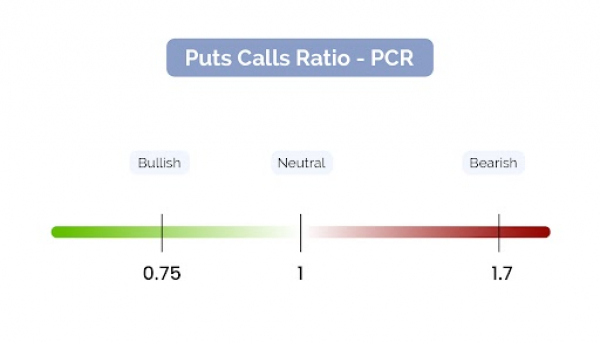
The Put-Call Ratio (PCR) is a key tool for analyzing options trading volume by comparing the number of put options traded to call options. As the best indicator for option trading, the PCR focuses on changes in its value rather than its absolute figure to gauge shifts in market sentiment.
When the PCR is above 1, it suggests that more calls are being purchased than puts, which generally signals a bullish market outlook. Conversely, a PCR below 1 indicates that more puts are being traded than calls, reflecting a bearish sentiment.
Additionally, some traders use the PCR as a contrarian indicator, choosing to trade against prevailing market trends in anticipation of potential reversals. By doing so, they aim to capitalize on shifts in market direction before they become widely recognized.
Relative Strength Index (RSI)
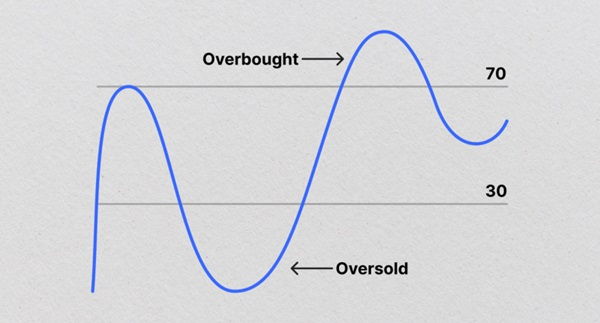
The Relative Strength Index (RSI) is a momentum indicator that evaluates the speed and change of price movements by comparing recent gains to recent losses over a set period. As the best indicator for options trading, RSI helps determine whether a security is overbought or oversold. RSI values range from 0 to 100, with readings above 70 typically signaling that a security is overbought and readings below 30 indicating it is oversold.
RSI is particularly effective for options on individual stocks rather than indices, as individual stocks often exhibit more pronounced overbought and oversold conditions. For short-term trading, options on highly liquid, high-beta stocks are ideal candidates for using RSI to make informed trading decisions.
Intraday Momentum Index (IMI)
The Intraday Momentum Index (IMI) is an ideal tool for high-frequency options traders focused on intraday movements. Renowned as one of the best indicator for option trading in India, the IMI blends the principles of intraday candlestick analysis with the Relative Strength Index (RSI). This combination helps pinpoint overbought and oversold conditions, making it particularly useful for intraday trading.
Traders can use the IMI to identify potential opportunities for bullish trades when the market is trending upward but experiencing temporary corrections. Conversely, it can signal when to initiate bearish trades during upward price bumps in a down-trending market. Since momentum indicators often show overbought or oversold signals in the context of strong price trends, staying alert to these trends is crucial for making informed trading decisions in the Indian market.
Supertrend
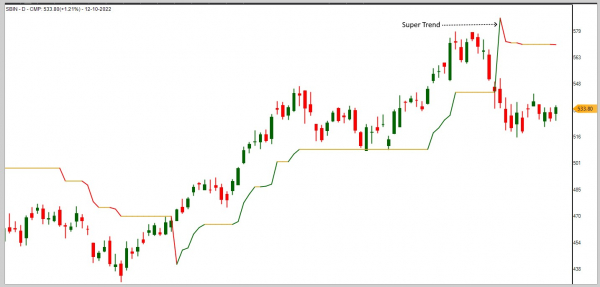
The Supertrend indicator, true to its name, is designed to highlight the prevailing market trend. It is a trend-following tool that leverages the Average True Range (ATR) in its calculations to provide clear buy and sell signals, which makes it popular among traders.
When the price of an asset is positioned above the Supertrend line, it signifies a bullish trend, suggesting that it might be a good time to consider buying call options. Conversely, if the price falls below the Supertrend line, it indicates a bearish trend, potentially signaling a good time to consider put options.
For options traders, the Supertrend can be particularly useful, especially for those who base their strategies on trend-following. It not only helps identify the current trend but can also signal possible trend reversals, which is crucial for making timely trading decisions. However, like any indicator, the Supertrend is not foolproof. It’s best used in conjunction with other indicators and in the context of broader market conditions and news to enhance decision-making.
Bottom Line
Options trading is complex and risky, demanding quick and decisive action. To navigate this challenging environment, it's best to use a trading system that combines multiple indicators to confirm trends before entering a position. For intraday trading, purchasing options can often be more profitable, but it’s crucial to close or adjust all trades before the market closes each day. This approach is generally suitable only for intraday trading. On the other hand, option writers may hold their positions until expiration to benefit from the decay of time value, known as theta decay.
While the indicators discussed are highly regarded for intraday trading, many traders customize and create their own sets of indicators to fit their individual strategies.
FAQs
Q. What is the most accurate indicator for option trading?
A. The RSI is generally preferred and is best for options on individual stocks than for indexes. This is because the stocks show overbought and oversold conditions more frequently than indexes. It is the volatility indicator.
Q. What is the best indicator for options trading view?
A. The Intraday Momentum Index is a good technical indicator for high-frequency option traders looking to bet on intraday moves. It combines the concepts of intraday candlesticks and RSI, thereby providing a suitable range (similar to RSI) for intraday trading by indicating overbought and oversold levels.
Q. What is the best indicator for expert options trading?
A. The RSI (Relative Strength Index) indicator is one of the most important and famous indicators used by traders around the world. An ExpertOption beginner might not understand how to use ExpertOption and earn money.
Q. Which is the best strategy for option trading?
A. The safest option strategy is one that involves limited risk, such as buying protective puts or employing conservative covered call writing. Selling cash-secured puts stands as the most secure strategy in options trading, offering a clear risk profile and prospects for income while keeping overall risk to a minimum.
Also Read: Paytm Secures Government Approval for Investment in Payments Division
POPULAR POSTS
Rupee Forecast 2025: Key Drivers Behind INR Weakness Against the US Dollar
by Shan, 2025-08-11 07:32:23
August 2025 IPO Preview: Big Listings from JSW Cement, NSDL, Knowledge Realty & SME Stars
by Shan, 2025-07-30 11:51:27
Ola Electric Q1 Results FY26: Revenue Falls 61%, Net Loss at ₹870 Cr - MoveOS 5 in FocusOla
by Shan, 2025-07-14 12:22:55
HAL, BEL & Data Patterns: 3 Defence Stocks Riding India's ₹50,000 Cr Export Ambition
by Shan, 2025-06-26 10:00:16
India GDP Forecast 2025-26 Raised to 6.5% by S&P: Key Drivers & Global Risks Explained
by Shan, 2025-06-26 10:30:46
Dalal Street Outlook: 5 Key Market Triggers to Watch This Week
by Shan, 2025-06-16 12:32:04
What is the Bond Market & How Does It Impact Your Investments?
by B2B Desk, 2025-02-05 09:42:55

Follow on Insta
RECENTLY PUBLISHED

How Praveen Gowdru Went From Building VMEDO To Launching Tez Health And Why He Betting On Home Healthcare
- by Aakash Ladha , 2026-07-01 11:01:27
What Is LLM Visibility? A Simple Guide to Checking Your AI Visibility
- by Aakash Ladha , 2026-07-15 11:44:33

How a Kerala Startup is Using Robots to Clean Sewers and Manholes
- by Aakash Ladha , 2026-07-14 12:14:26

Luxemettle Redefining Indias Jewellery Market With Personalized Craftsmanship and Story Driven Design
- by Aakash Ladha , 2026-07-14 12:07:23

OpenAI Launches GPT-Live: Making Conversations with ChatGPT Feel Truly Human
- by Aayush Ladha, 2026-07-14 12:28:52
x
![logo]()